Enhancing VarSeq Customization and Automation with Visual Studio Code: A Guide to Evaluation and Reporting Scripting
Are you as excited as we are about the new automation and customization features we’ve been rolling out with VarSeq’s most recent release, VarSeq 2.3.0? Do your eyes light up at the prospect of automated integration of various data sources into VarSeq’s evaluation and reporting framework? Does your list of evaluation scripts you’d like to implement read something like an 8-year-old’s holiday wish list in terms of tone and ambition? Our Field Application Scientist team loves helping groups realize their customization needs, and there is nothing more satisfying than giving our customers the tools they need to fully capitalize on VarSeq’s capabilities. If you’d like us to watch you ride off into the scripting sunset with proud tears in our eyes, then allow me to introduce you to one of the hottest collaborations in the industry, VarSeq and Visual Studio Code (VSCode).
Most people with any kind of development experience will be familiar with VSCode, Microsoft’s popular and highly configurable source code editor. Those of you who have read any of my recent blogs or attended some of our webcasts referencing automation will know that I use the term “highly configurable” often and reverently enough to emulate some sort of bioinformatic incantation. This is precisely why VSCode and VarSeq work so well together. VSCode’s coding infrastructure allows VarSeq users to easily write, debug, and implement custom scripts for both automating VSClinical workflows and producing custom reports. I’m excited to provide an overview here of how our users can explore these capabilities.
There are two main avenues for interacting with VarSeq through VSCode, both of which are within the VSClinical evaluation and interpretation module. These avenues are (1) evaluation scripts, customizable scripts that allow users to import, export, and manipulate data within the VSClinical module, and (2) custom scripts within the VSClinical reporting section, which allow users to integrate VarSeq’s exports with external systems and augment the data being produced by evaluations performed in VSClinical. While evaluation scripts are currently only available in VSClinical AMP, our VSClinical ACMG users can look forward to analogous features that will be introduced in our next release of VarSeq. Custom report scripts, however, are currently available in both VSClinical ACMG and VSClinical AMP. Let’s take a look at these various points of ingress into VarSeq’s customizable workflows and explore how to implement and debug custom scripts with VSCode.
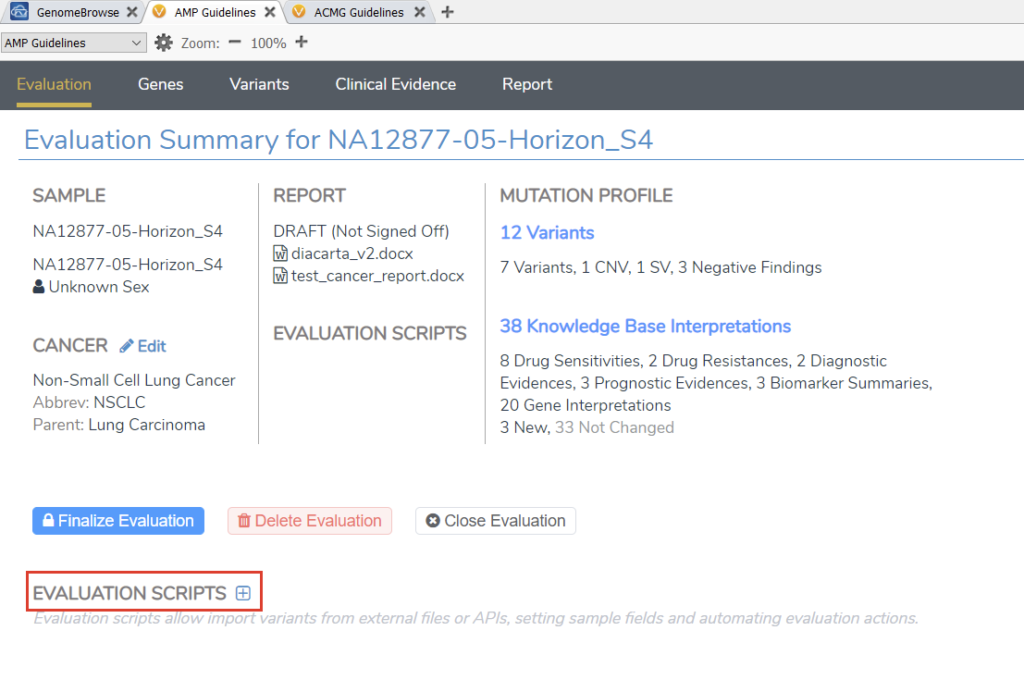
Evaluation scripts allow users to define routine workflows within VSClinical. These can be run through the VSClinical graphical user interface or implemented within VSPipeline command line scripts to provide GUI-less integration of automated workflows. Within VSClinical, evaluation scripts can be accessed and edited in the Evaluation tab of VSClinical (Figure 1). Clicking the blue plus button will open a list of available evaluation scripts. From here, the default shipped scripts can be added to evaluation, or users can opt to create a new script, which can be empty, or use an existing script as a starting point.
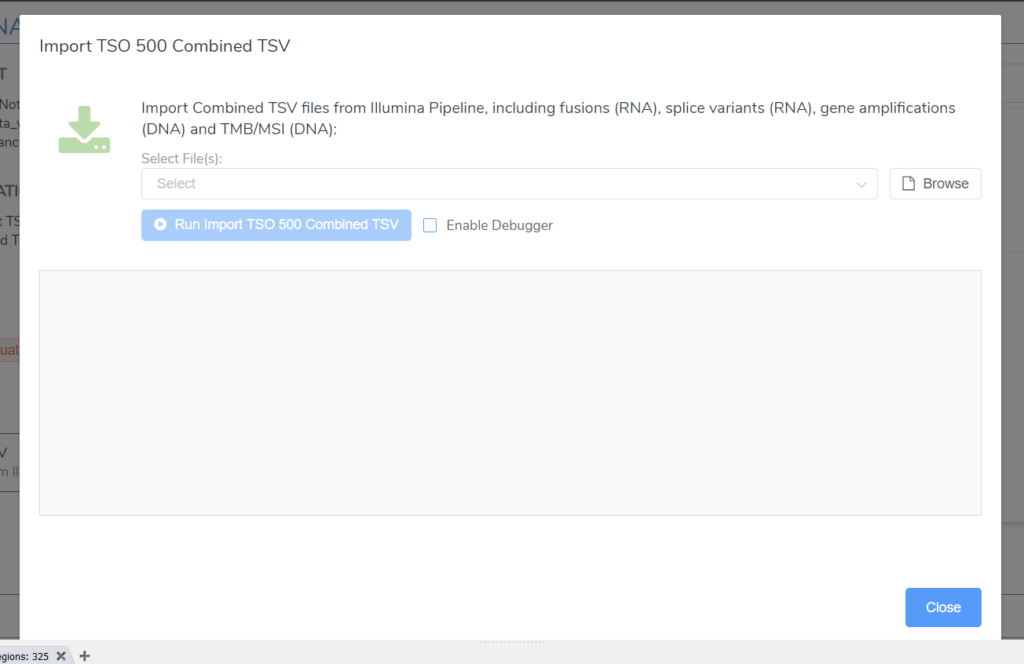
As an example, suppose we want to employ the Import TSO 500 Combined TSV default script. Adding it will render an executable copy of the script in the current workflow. In this case, clicking “run” opens a window that asks for an input TSV file (Figure 2). For most users, selecting the TSO 500 combined TSV and starting the script will be sufficient. For the more ambitious among our users, however, selecting the “Enable Debugger” option will display a help message with instructions to connect the selected script to VSCode’s debugger (Figure 3).
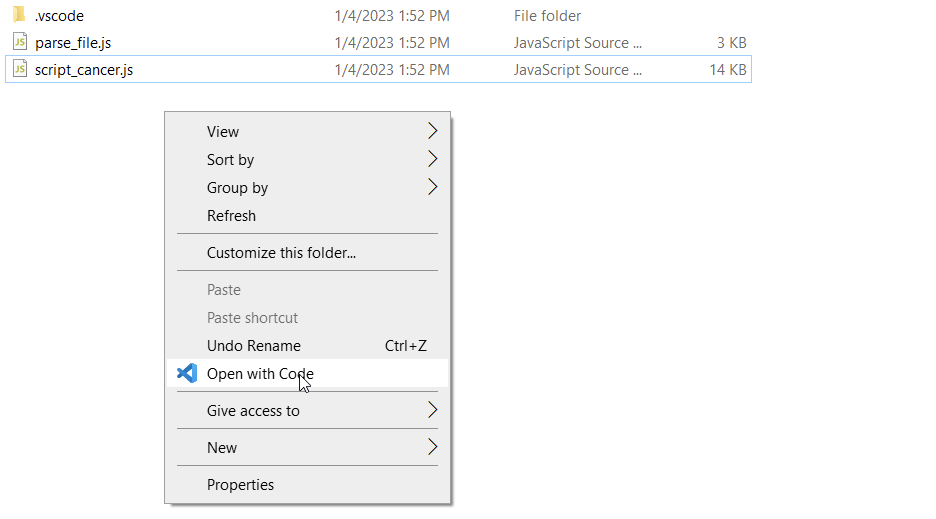
Following the steps outlined in the help message, we can view the source code for this evaluation script. Selecting “open folder” and proceeding to start VSCode will open the associated code (Figures 4 & 5). In this case, we can see that there are actually two JavaScript files associated with this script, one to parse the contents of the TSV into a JSON file and the other to interface with VSClinical AMP’s API and populate the various fields with the information in the JSON.
This process is interesting in itself. Simply by viewing what’s going on under the hood of these evaluation scripts, users can better understand how these processes are implemented. In this case, for instance, users can view (and edit) the thresholds for TMB (Figure 6) or explore some of the API functions used to interact with VSClinical AMP.
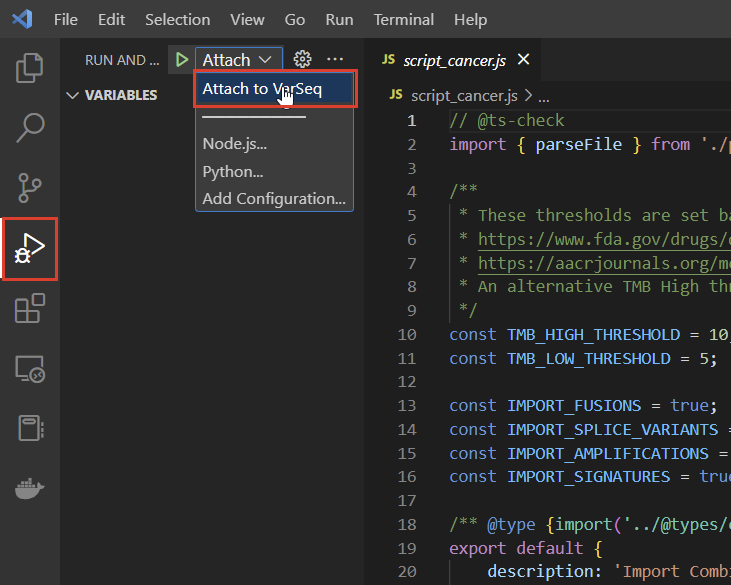
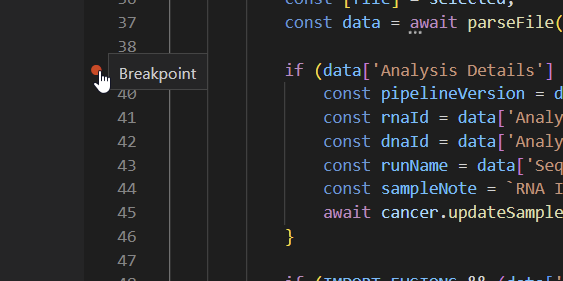
Unsurprisingly, however, the fun doesn’t stop there. With the debug dialogue opened in VSClinical and VSCode open, users can attach VSCode’s debugger to VarSeq and set breakpoints to better understand the included functions and debug any novel changes (Figure 7). Clicking “Attach to VarSeq” and then clicking run will run the script and produce any error messages or other output in VSCode’s terminal. In this case, we would have to specify an input file in the function arguments to produce an output. However, that doesn’t stop us from choosing breakpoints to explore the script’s state at any point. To create a breakpoint, simply click on the red dot that appears next to any line as you hover over the line in the margin (Figure 8).
The debug menu that appears at the top of the window when you run the debugger then allows you to step through your script from breakpoint to breakpoint (Figure 9). At each breakpoint, you can view the current variables on the left side of the screen.
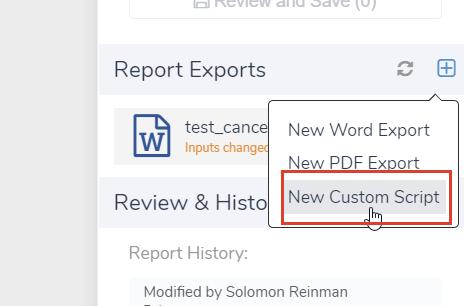
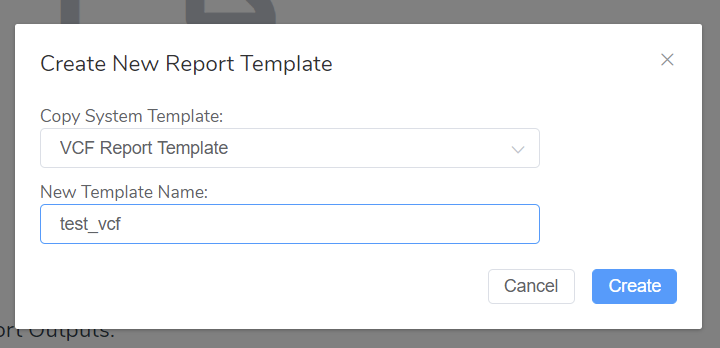
While this example doesn’t yield particularly interesting results, this is a very useful tool for better understanding the data structures being parsed by VarSeq and for writing and debugging your own automated scripts. The example provided here is just the tip of the iceberg. The same functionality can be found in the VSClinical Reports tab. By selecting “New Custom Script” and defining a new custom report template (Figures 10 & 11), users can access VSClinical’s reporting infrastructure and modify existing fields, create logic for interpreting information produced by the evaluation, and even import or export data from a LIM system with API calls supported by VarSeq’s JavaScript runtime environment. Debugging via VSCode is accessed in the same way here as in the evaluation script example.
Hopefully, the content of this blog has piqued the interest of current and future users without being too intimidating. The tools discussed here should be more than enough for those with scripting experience to get started and should also provide a useful starting point for those looking for help with scripting and automation within VarSeq and VSClinical. As always, the FAS team is at the disposal of our customers exploring new ways to improve their workflows. Please don’t hesitate to reach out to [email protected] if we can be of any assistance.
